Not jump advice. This is a personal technical reconstruction and a teaching simulator. Follow your DZ, S&TA, and current USPA guidance.
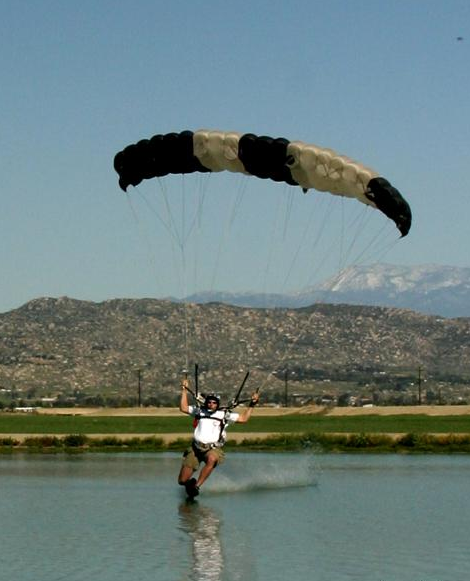
After fighting my parachute opening for 500 ft, I would find myself on a 96 sq ft cross-braced canopy weaving in and out of parachute traffic to land. Skydiving had started to feel like a high-stress wait for the next conflict.
That was new. Most of my previous 700 jumps on that canopy opened around 3,000 ft. Because I was on a high-performance canopy, I was usually the first one down on the load. Often I was taking my rig off in the packing area before the last belly group was down. For most of my first thousand skydives, I barely had to think about traffic.
Something changed in the early 2000s. A post on the now-defunct dropzone.com, plus a Flash simulation, helped convince people that belly fliers should go first. The argument was straightforward: belly fliers fall slower and drift longer, so if they exit after freefliers they can drift over the freefly group. A freefaller could hit an open canopy below.
Putting belly fliers first reduced that freefall-over-canopy scenario. But from under my canopy, the change always felt backwards. At drop zones using that configuration, I kept seeing the same pattern: more people low, more people on level, more weaving through traffic.
The hunch
I also started noticing what felt like more canopy-collision fatalities after this exit-order convention became common. I emailed USPA Safety with the theory. They acknowledged the concern, but ultimately brushed it off. Every so often I would fall back into the dz.com drama and argue the case again.
One of those times I wrote a little simulator as a web game. It lived here for years as the old Freefall drift simulator. It showed the core visual point: when belly fliers go first and freefliers go last, a lot more canopies can end up at similar altitudes at the same time.
Relative risk in canopy-collision fatality share after the scan-selected 2007 cutoff.
Scenarios where freefly-first had higher landing-pattern exposure than belly-first/freefly-last.
Median max canopies below 1,000 ft: belly-first/freefly-last versus freefly-first.
The rebuilt simulator
I decided to revisit the whole thing with an AI agent helping on the implementation. The goal was not just to make the old toy prettier. I wanted the missing pieces: wind direction, stochastic deployments, a real landing-area model, current winds-aloft inputs, and a way to run thousands of jump runs instead of arguing from one animation.
Freefall Drift Explorer
Change the exit order, winds, manifest size, and Monte Carlo run count. The embedded build uses the same westcot.io visual system.
What changed technically
- Wind model: winds are now aviation-style wind-from directions, converted internally into drift vectors and interpolated by altitude.
- Monte Carlo: the simulator can sample thousands of seeded jump runs instead of displaying one deterministic jump.
- Deployment model: pull altitude, opening loss, fully-open altitude, and canopy descent rate vary by run.
- Landing model: canopies converge toward a realistic landing area instead of pretending everyone lands on the same dot.
- Fatality data: the agent helped scrape and verify USPA / Parachutist fatality summaries back to 1999, with source issue/page references for the older archive material.
The metric the agent added
To my surprise, the agent introduced a risk metric without me explicitly asking for it: landing-pattern exposure seconds. The idea is simple. If two open canopies are in the landing-pattern band at the same time, that pair contributes exposure. If many canopies are low together, the pair count rises quickly.
One pair close in the pattern for one second is one pair-second. Five simultaneous pairs for two seconds is ten pair-seconds. The model weights the exposure higher closer to the ground because options disappear as everyone approaches the landing area.
| Scenario | Belly-first / freefly-last | Freefly-first | Ratio | Median <1000 ft | Median <500 ft |
|---|---|---|---|---|---|
| README/default, 8 jumpers | 810.47 | 348.68 | 0.43 | 6 vs 4 | 4 vs 3 |
| README/default, 14 jumpers | 1597.07 | 875.57 | 0.55 | 7 vs 5 | 5 vs 4 |
| Light winds, 8 jumpers | 901.07 | 464.07 | 0.52 | 7 vs 4 | 5 vs 3 |
| Strong upper winds, 8 jumpers | 694.05 | 304.27 | 0.44 | 6 vs 3 | 4 vs 3 |
The direction matched my memory: when freefliers are out last, more jumpers are under 1,000 and 500 ft together. In the default ten-jumper check, belly-first/freefly-last produced a median of 7 canopies below 1,000 ft and 5 below 500 ft; reversing the order produced 4 and 3.
The fatality data
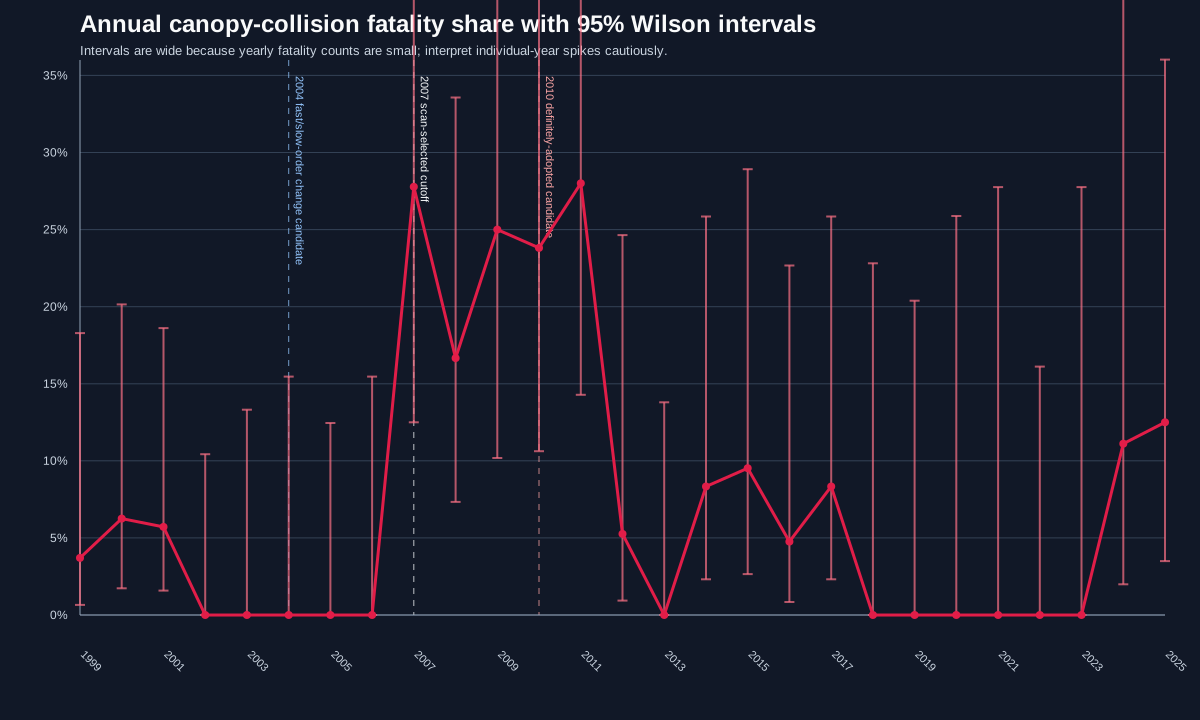
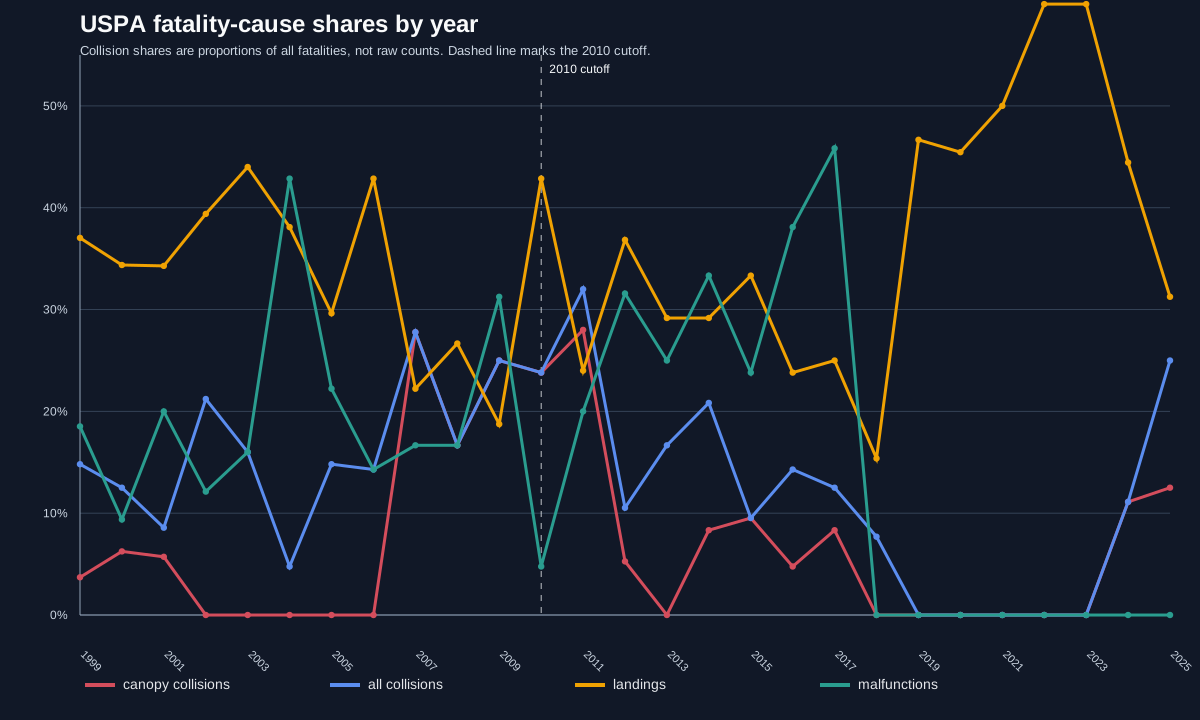
The data work was the other half of the revisit. The agent pulled together annual fatality summaries, scraped old Parachutist back issues where needed, and generated a cutoff scan across years. This does not prove causality, but it does check whether the real-world direction is compatible with the story.
What this revisit let me do in a few hours
- Update the wind simulator to use a more robust wind-from vector model.
- Add Monte Carlo simulation capability for thousands of jump runs.
- Retrieve old Parachutist back issues and extract fatality-summary data back to 1999.
- OCR / verify the historical rows against issue pages where available.
- Create a statistical model to test my hunch about canopy-collision increases around the mid-2000s.
- Compare the full narrative against lived experience, model behavior, and historical data.
The short version: the old fear was freefallers drifting over canopies. My experience was the landing pattern getting crowded. The rebuilt simulator and the fatality-data scan now point in the same direction: freefliers out last can plausibly increase low-altitude canopy-congestion risk.
FAQ
Why did the fatalities and collisions fall after 2011?
Good question. The honest answer is that this analysis does not identify a single cause. It sees a rise in canopy-collision share around the 2007 cutoff, then a noisy decline after the 2007-2011 cluster. A few plausible explanations can all be true at once.
One operational possibility is load size. More PAC loads and other smaller turbine loads would mean fewer people sharing the same opening and landing window. Four jumpers out of a Cessna have drastically lower collision exposure than a full turbine load; the number of possible pairs grows roughly with n(n-1)/2. Big airplanes like Casas and Twin Otters exacerbate the effect because one pass can put a lot more canopies into the same low-altitude system.
Another possibility is behavior. After a run of high-profile canopy-collision deaths, jumpers, S&TAs, and DZs may have become more alert to the problem. Swoopers increasingly took their own pass or separated themselves from the main pattern. Even without a single national rule change, local awareness can change exit separation, breakoff discipline, canopy choice, landing pattern behavior, and willingness to mix aggressive high-performance approaches with normal traffic.
Does this prove freefliers-out-last caused the fatalities?
No. The simulator shows a plausible mechanism: in the tested scenarios, belly-first/freefly-last produced materially more low-altitude canopy exposure than freefly-first. The fatality data shows that canopy-collision share was higher after the strongest scan-selected cutoff. Those two facts point in the same direction, but they are not causal proof.
Why look at fatality share instead of raw fatality counts?
Raw counts mix the specific mechanism with the overall safety trend of the sport. If total fatalities fall because gear, training, AAD use, medical screening, or participation changes, a raw canopy-collision count can fall even while canopy collisions remain an unusually large slice of the remaining fatalities. Shares are still imperfect, but they ask the narrower question: within the fatalities that occurred, did this cause become more or less common?
Why ignore horizontal separation in the landing-pattern exposure metric?
Because the model cannot know real canopy-pilot intent. In the pattern, jumpers do not passively keep whatever horizontal spacing the freefall simulation gives them. People fly toward the landing area, hold, set up, and converge. For this version, the more defensible comparative metric is open-canopy pair time below 1,000 ft AGL, weighted more heavily near the ground, rather than pretending the toy horizontal positions are a calibrated collision predictor.
Appendix
What the simulation rewrite covers
- Modern deterministic core: the old AngularJS/Flash-era argument visualizer was rebuilt as a Vite / TypeScript simulator with a separate physics core, SI-unit internals, seeded randomness, and tests.
- Jumper phases: each jumper moves through freefall, deploying, canopy, and landed phases instead of being a single fixed dot on a drift line.
- Body-flight differences: belly fliers and freefliers have different fall rates and horizontal-drift behavior; freefliers retain aircraft throw longer while belly fliers slow and reverse toward wind drift sooner.
- Aviation wind model: editable winds at multiple altitudes are treated as wind-from directions, converted into drift vectors, and interpolated by altitude. The UI can also load current winds-aloft forecasts while keeping manual controls.
- Exit-order experiments: the simulator compares belly-first/freefly-last against freefly-first using the same manifest, wind layers, and exit separation so the order effect is isolated.
- Stochastic deployment: planned pull altitude, actual pull altitude, opening loss, fully-open altitude, and canopy descent rate vary by seeded run.
- Landing-area model: canopies fly toward an upwind pattern target above 1,000 ft, then converge toward normally distributed landing targets around the spot instead of all landing on one point.
- Monte Carlo runs: the browser and CLI can sample hundreds or thousands of jump runs and report distributions instead of relying on one animation.
- Exposure metrics: the analysis records maximum simultaneous open canopies below 1,000 ft and 500 ft, plus weighted landing-pattern pair-seconds as the primary relative-risk metric.
- Fatality-data pipeline: USPA and Parachutist fatality summaries were collected back to 1999, including old rendered-page archive scraping, source references, cause-category tables, cutoff scans, and SVG charts.
Wilson intervals
The chart uses Wilson score intervals for yearly canopy-collision fatality share because each year has a small denominator. A normal approximation around p = x/n behaves badly when counts are near zero; Wilson intervals stay bounded between 0 and 1 and are more stable for sparse annual data.
Wilson center = (p̂ + z² / 2n) / (1 + z² / n)
Wilson half-width = z · sqrt((p̂(1-p̂)/n) + z²/(4n²)) / (1 + z²/n)
For the 95% intervals shown in the visualization, z = 1.96, x is canopy-collision fatalities in that year, and n is total fatalities in that year.
Relative risk
The pre/post comparison treats canopy collision as a share of fatalities on each side of a cutoff year. Relative risk is the after-period share divided by the before-period share:
For the scan-selected 2007 cutoff, the table is 5/221 before 2007 versus 37/347 from 2007 onward. That is 2.3% versus 10.7%, or RR = 4.71 with a reported 95% confidence interval of 1.88-11.81.
The cutoff was selected by scanning eligible split years, so the page reports both an uncorrected Fisher exact p-value and search-aware checks: Bonferroni adjustment across the cutoff scan and a permutation scan p-value. That makes the result more conservative than simply picking the best-looking year after the fact.