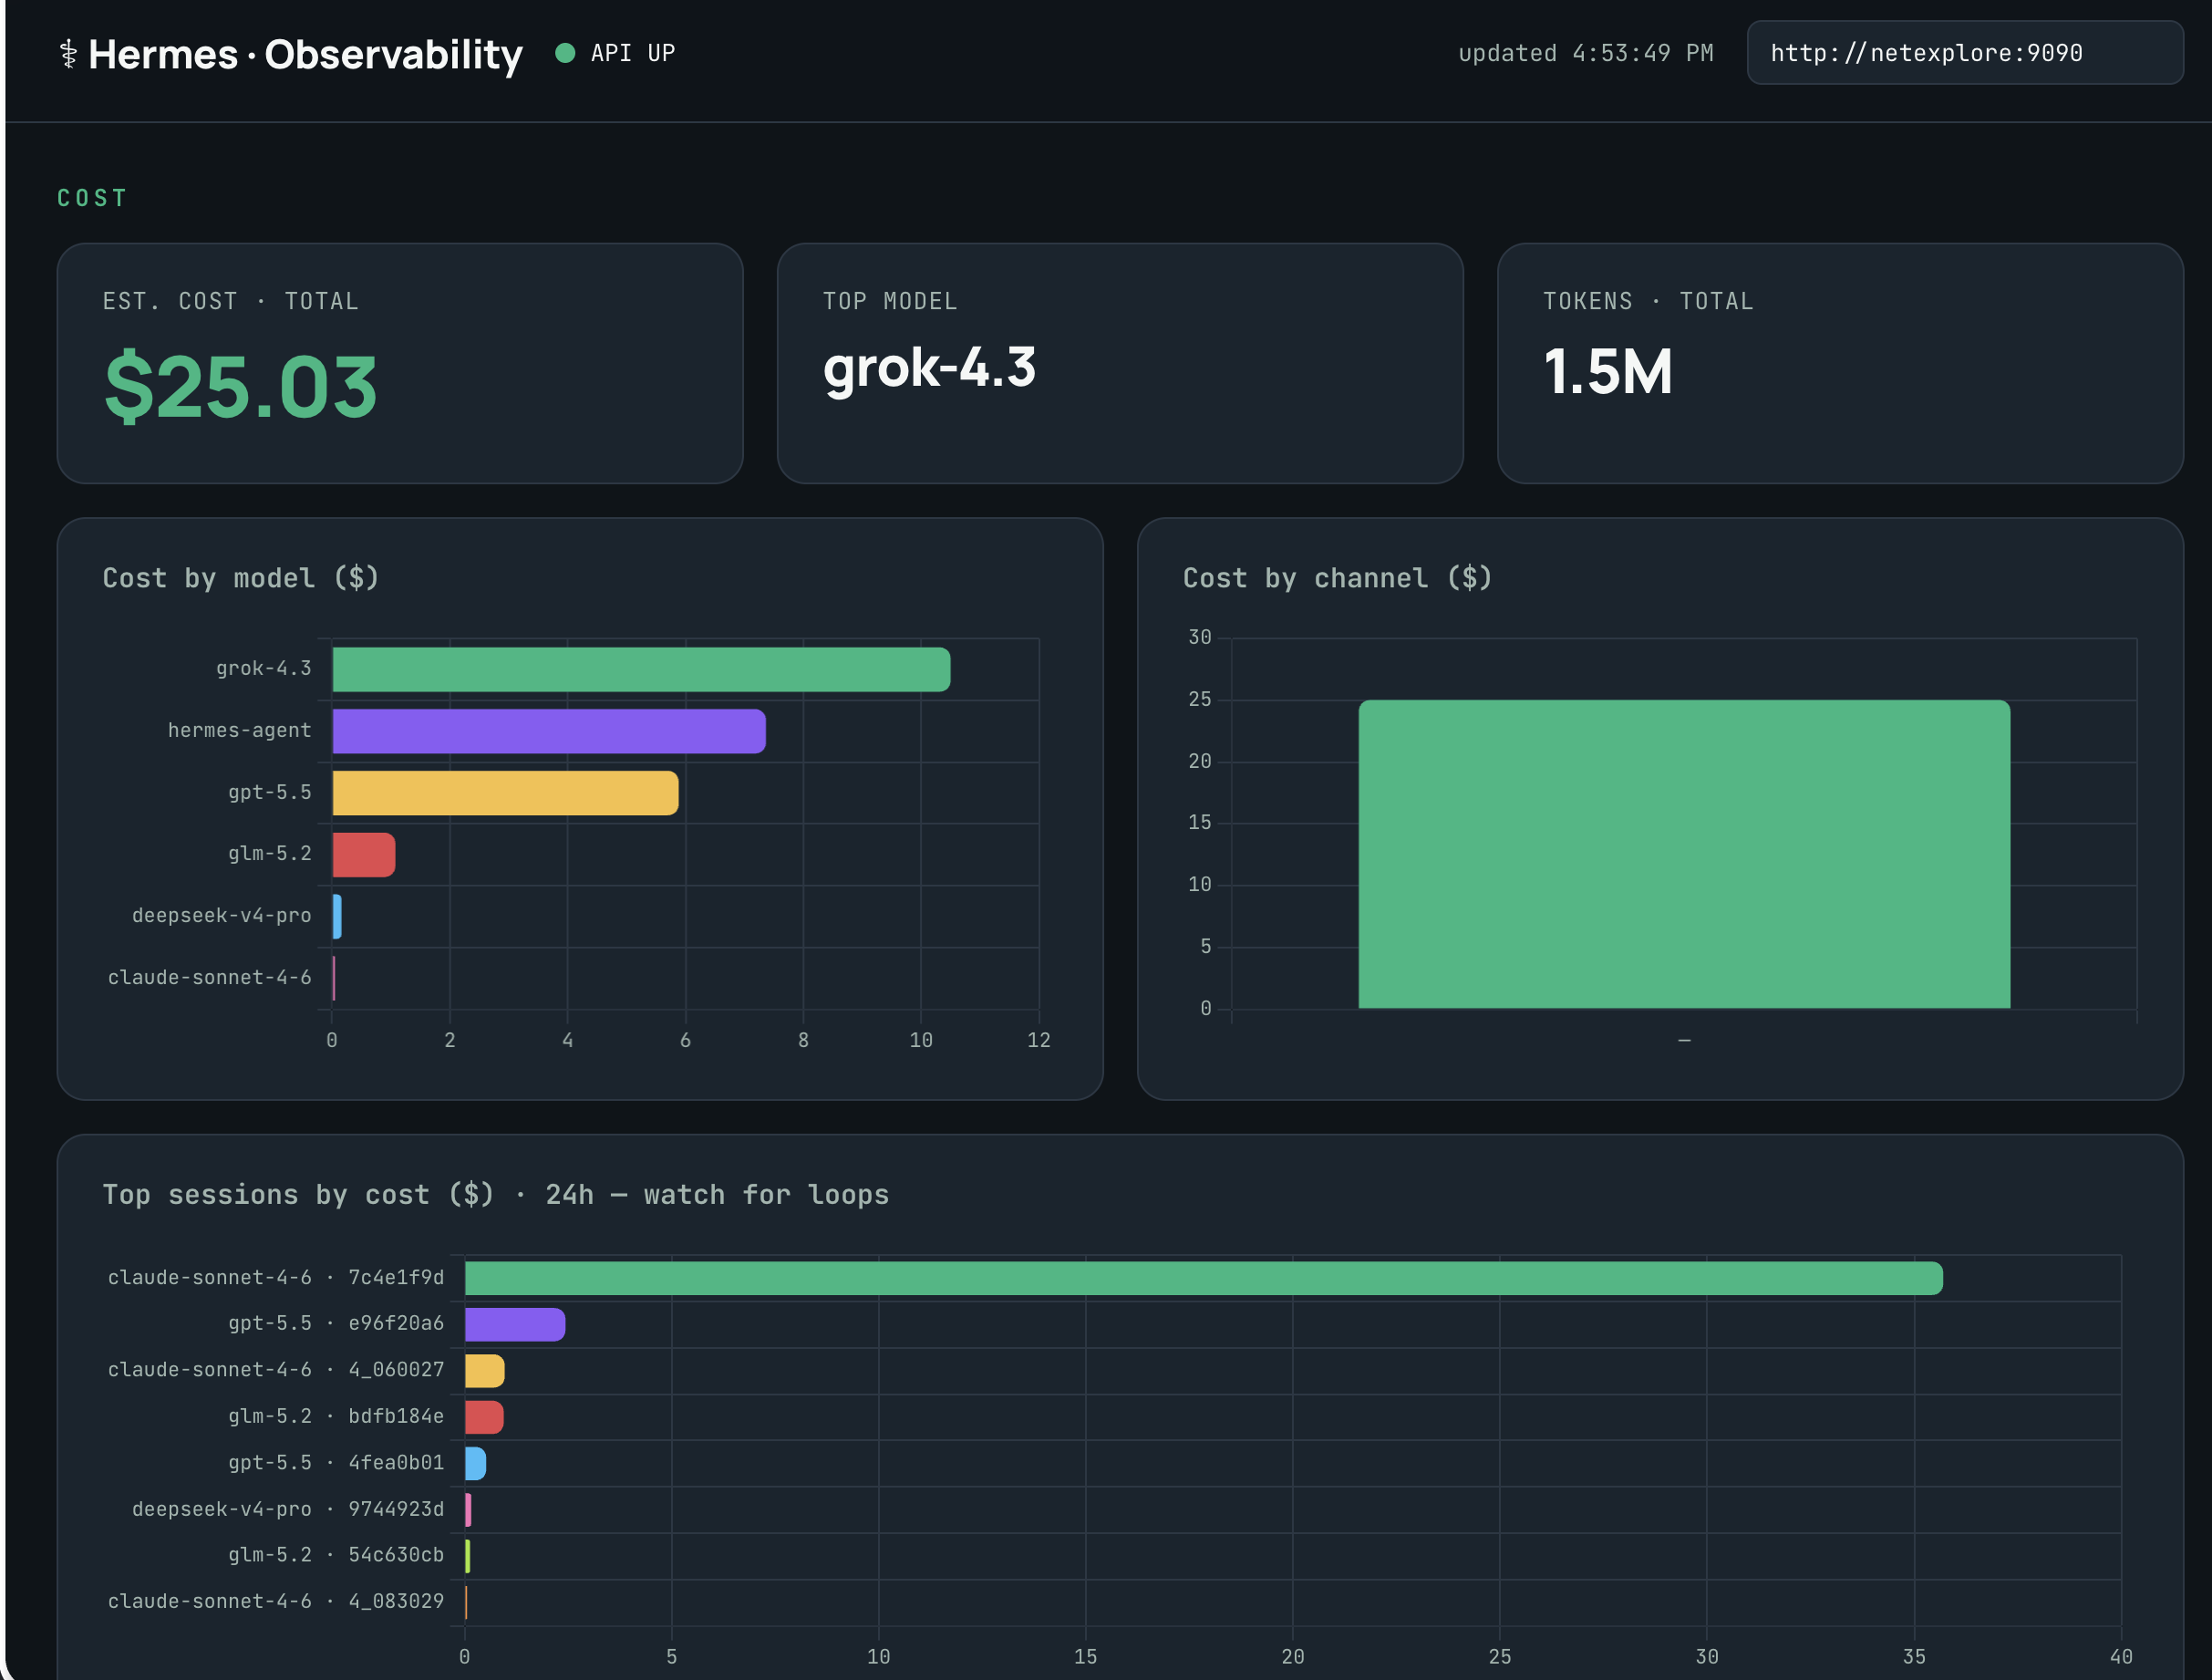
A self-hosted monitoring stack the Hermes agent runs on itself — Prometheus, Alertmanager, and an off-box deadman heartbeat — surfacing cost, errors, and latency first, in that order. One install script reproduces the whole thing on any Pi. Open source & reusable — point it at your own metrics DB.
Hermes already records token usage and an estimated cost per session in state.db — the exporter just sums it by model, provider, and channel. No new instrumentation needed.
+ per-endpoint request count · status · latency from the api middleware (:9102).
Everything runs as system systemd units that survive reboots, installed by a single idempotent script — re-run it on any Pi to reproduce the stack. The exporter lives in its own contained venv so it can't disturb the agent's environment.
Host metrics — disk space, CPU, memory, network.
Reads the agent's state.db — tokens, cost, requests, sessions — plus an api_server health probe.
Scrapes both every 30s, keeps 30 days, and drives the alert rules.
The exporter turns the agent's own ledger into Prometheus series: input / output / cache / reasoning tokens, estimated & actual cost, API and tool-call counts, active sessions, and a session-duration histogram as a latency proxy — all labeled by source, model, and provider. It runs standalone rather than as a Hermes plugin so it keeps reporting even when the gateway is wedged — exactly when you want the data.
Alertmanager (:9093) reuses the Hermes Telegram bot token, so alerts land in the same DM — no new bot. Rules cover low disk, elevated API error rate, api-server down, and a runaway-cost rate guard. But if the whole Pi dies, Prometheus dies with it — so the deadman heartbeat runs on the always-on Synology NAS, probing the Pi every ~5 minutes and pinging Telegram if it goes dark.
Instead of a Grafana process, the dashboard is a single self-contained HTML page that queries Prometheus directly over CORS and renders with Chart.js — version-controlled, house-styled, and 20s auto-refresh. Grafana still works if you want it; the static page is the lightweight default.