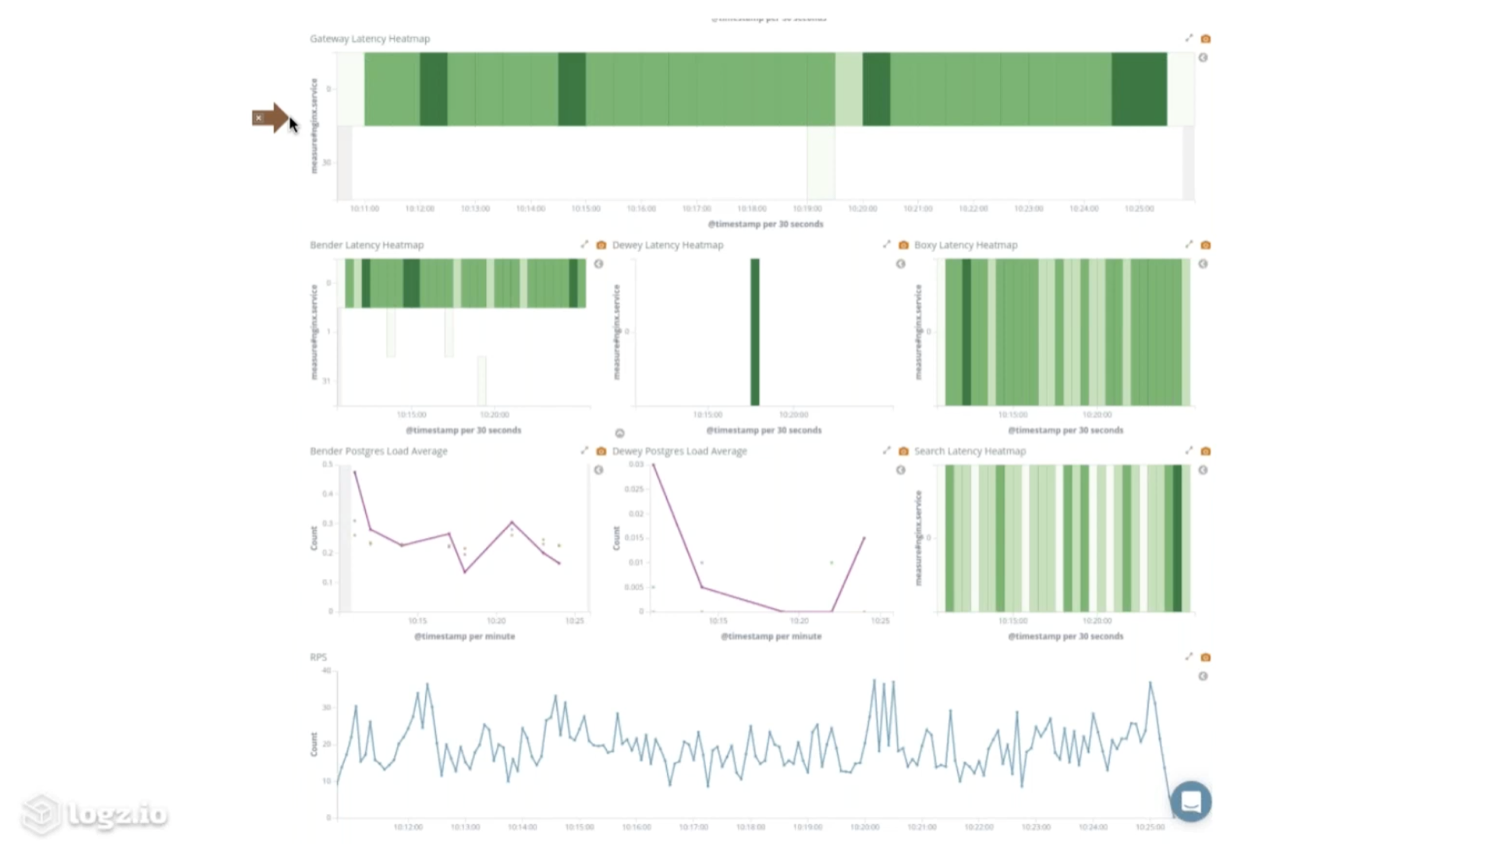
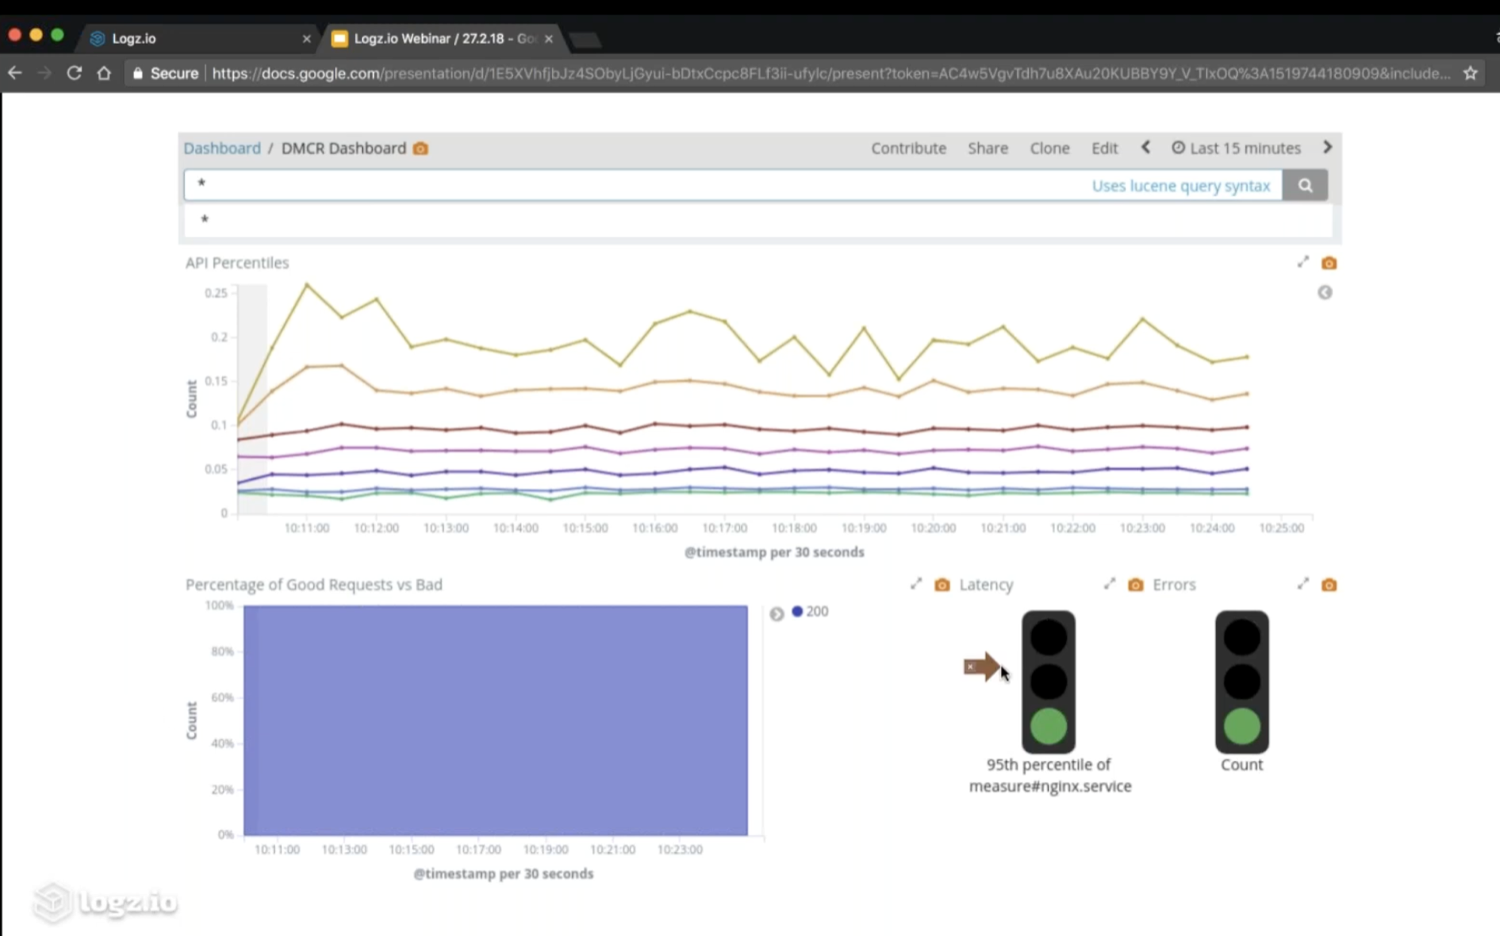
Finding performance problems by evidence, not guesswork. A gateway dashboard surfaced request latency, and every service behind the gateway reported its own latency into the same view — built on Kibana via Logz.io. I was invited to share how we ran it at Red Bull Media House to monitor microservices health.
Gateway latency up top; each service behind it (Bender, Dewey, Boxy, Search) with its own latency heatmap, Postgres load, and request rate.The gateway view: API latency percentiles, good-vs-bad request ratio, and at-a-glance latency / error signals.